

III-2 Making CSV Data for Drawing
The Figures in Matsuoka et al. (2003) have been made by exporting data in CSV format and reading it in with an application called Sigma Plot. In this section, we shall explain how to output files in CSV format.
Export from GUI
There are two ways to export data in CSV format. The simBio GUI provides a function to export the displayed graph object in CSV format. Therefore, if you run a simulation which is set to display a graph, you can extract it with [File]->[Export to CSV] in the menu.
Export with CSV Maker
There is another way, which is to add a function element to an XML file for extracting data in CSV format. This method is applied so that a time-consuming GUI is not used, when various parameters are provided to the model, like in the section below, and it is run automatically and the results are totalled. Here, this function is used, and the data for Figure 8A of the article is created.
"csv maker" has been inserted in xml/matsuoka_et_al_2003/model.xml ot simBio beforehand. Those file settings are shown below.
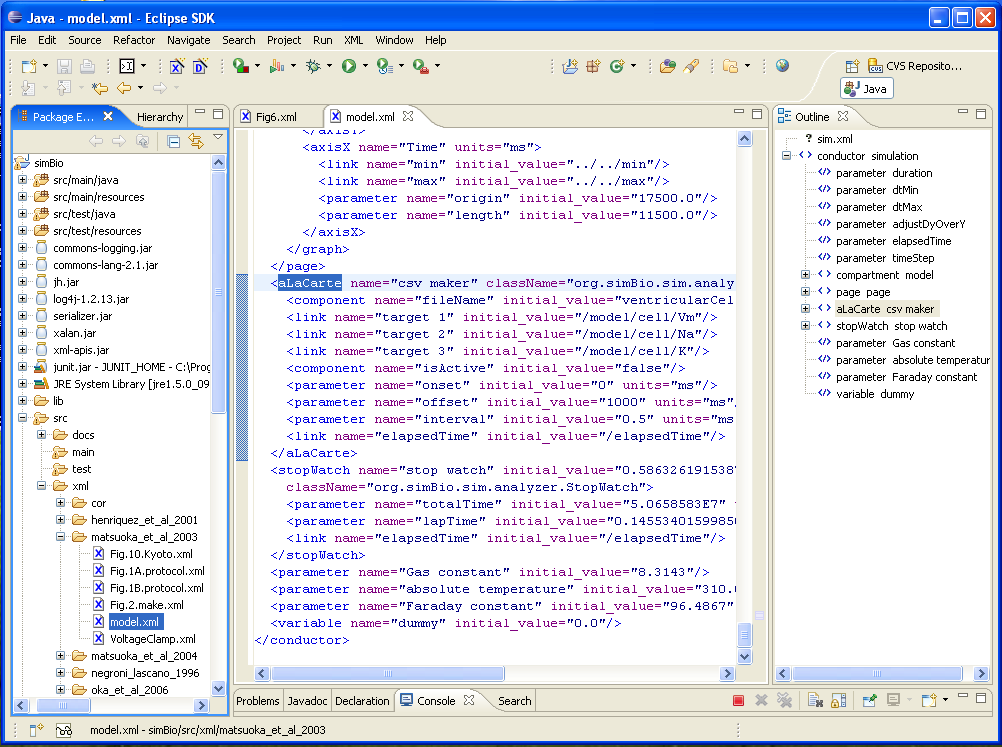
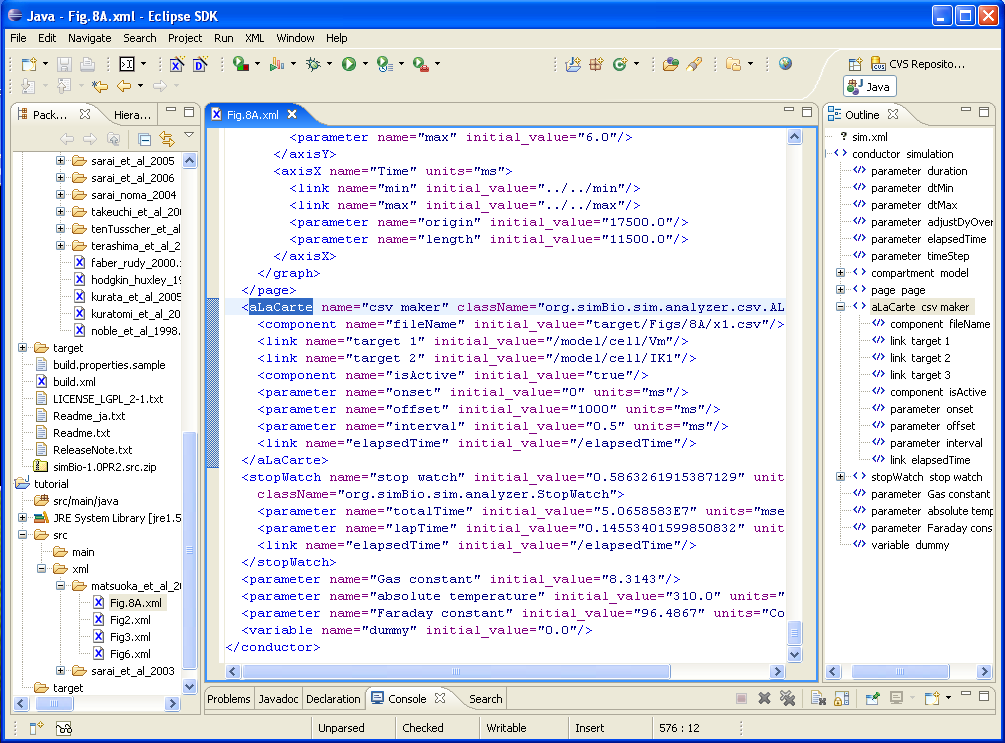
Explanations are written in XML comments (sections are enclosed in <!-- and -->). In order to create the CSV file for Figure 8A, first, copy simBio/src/xml/matsuoka_et_al_2003/model.xml into the tutorial project as Fig.8A.xml. To extract the value of IK1, change csv maker/target 2 to /model/cell/IK1, and delete target 3 since it is unnecessary. To distinguish the created file more easily, change the fileName value to target/Figs/8A/x1.csv, and to activate the recording function, set isActive to true.
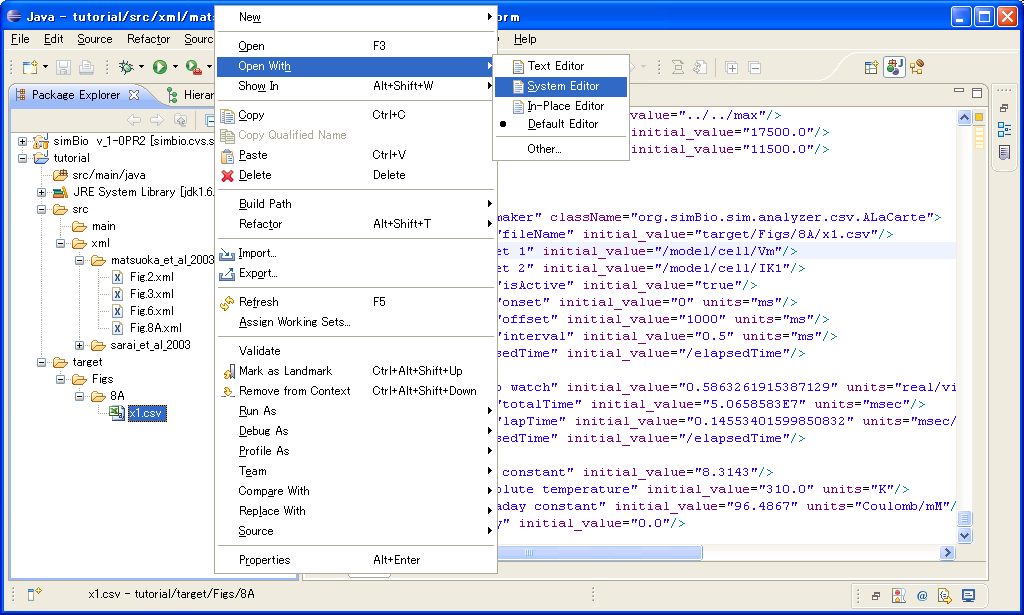
Right click on the completed Fig.8A.xml, start it with [simBio]->[Run on GUI] same as before, and run the simulation. When it finishes, select the tutorial project, then choose [Refresh] with a right click, and you can see that x1.csv has been created in the folder target/Figs/8A. If you right click on this, then click on [Open With]->[System Editor], then it will be opened with the application which is associated with CSV files, such as Notepad or Microsoft Excel etc. Use Excel here.
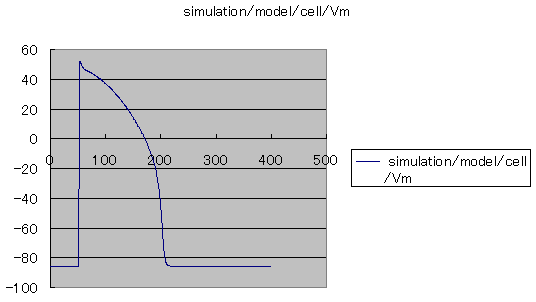
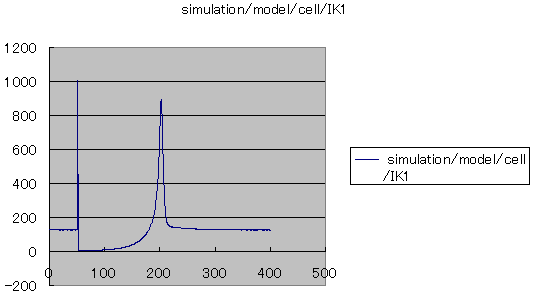
You can see that in the CSV file, in the first column the time progress is recorded, in the second column action potential, and in the third IK1 (pA).
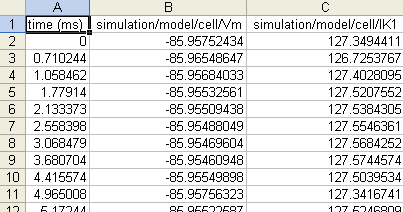
When a scatter diagram is created with the first column time as the horizontal axis, and the second column membrane potential as the vertical axis, and you can see the upper plot in Figure 8A (x 1 graph). The lower plot in Figure 8A can be plotted with the first column as the horizontal axis, and the third column as the vertical axis.
When you change IK1/permeabilityK/amplitude which sets the size of IK1 and extract the data after it has reached a steady state, Figure 8A in Matsuoka et al, (2003) can be reproduced.